Deploy OpenTelemetry Monitoring Stack
The monitoring stack you will use leverages the OpenTelemetry (OTel) ecosystem to meet your environment’s observability requirements. OTel standardizes how telemetry data such as logs, metrics, and traces is generated and exported. Any backend that supports the OpenTelemetry Protocol (OTLP) is compatible, making the OTel stack one of the most flexible and vendor-neutral observability solutions available. OTel is widely supported by a variety of monitoring and backend tools, including Prometheus, Jaeger, OpenObserve, and Datadog.
Use the following steps to deploy a monitoring stack with OpenTelemetry and configure a host cluster to forward metrics to OpenObserve.
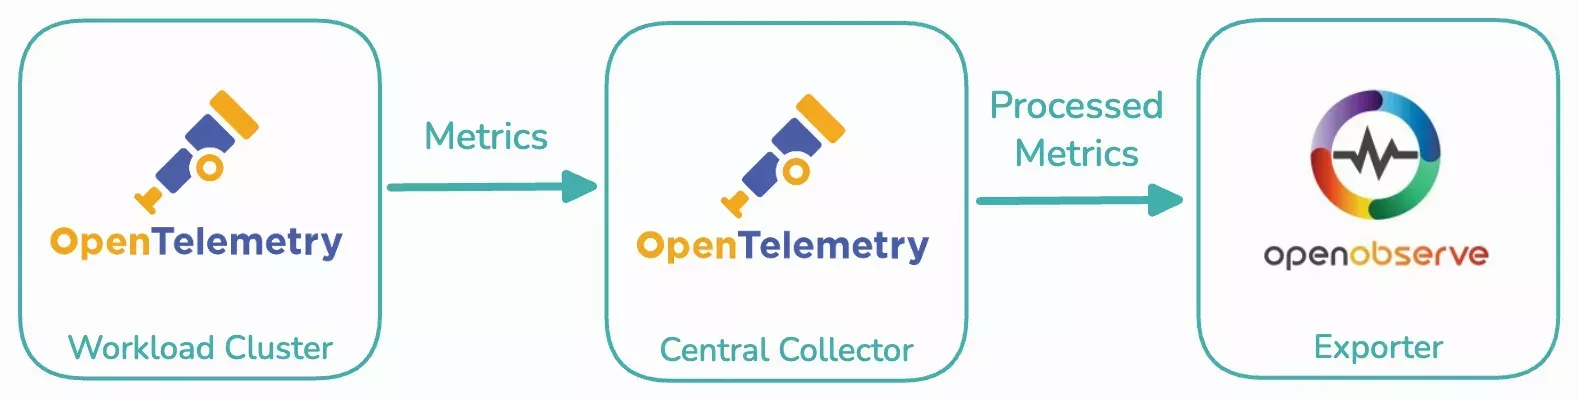
The stack uses the following architecture:
- One or more workload clusters are instrumented with OpenTelemetry to gather metrics. These metrics are sent to a centralized component known as the central collector.
- The central collector is configured with OpenTelemetry and is responsible for receiving, processing, and forwarding the telemetry data.
- The collector uses an exporter to send the processed metrics to OpenObserve, which acts as the observability backend and provides a dashboard to visualize the metrics.
Workload clusters can be configured to send telemetry data directly to a backend system such as OpenObserve by including an exporter in the configuration of each cluster. However, we recommend deploying a central OpenTelemetry collector, as it centralizes authentication and external traffic configurations in a single cluster, simplifying management and reducing duplication.
Prerequisites
- A Palette account.
- Three or more healthy VMware, MAAS or Edge clusters.
- Network connectivity between the clusters.
Deploy an OpenTelemetry Monitoring Stack
The following steps create cluster profiles for the workload cluster, central collector, and exporter. Then, you deploy them to your deployed healthy clusters.
Create and Deploy the Exporter Cluster Profile
-
Log in to Palette.
-
Navigate to the left main menu and select Profiles to view the cluster profile page. Select Add Cluster Profile. The cluster profile creation wizard appears.
-
Enter
exporter-profileas the name of the cluster profile. Then, select Add-on as the cluster profile Type and select Next.Add the following packs in your cluster profile with customizations that suit your environment. Then, select Next.
Pack Version Registry Customization MetalLB 0.13.x Palette Registry (OCI) Set an IP range that is available in your environment in the manifests.metallb.addressesfield.PostgreSQL 1.22.x Palette Registry (OCI) No customization required. Open Observe 0.14.x Palette Registry (OCI) Set a user email in the charts.openobserve.auth.ZO_ROOT_USER_EMAILfield or leave the default value ofadmin@openobserve.dev. Set a user password in thecharts.openobserve.auth.ZO_ROOT_USER_PASSWORDfield.Construct a Base64 encoding of the credentials you have configured in the format
useremail:passwordin the Open Observe pack. For example, the stringadmin@openobserve.dev:adminis encoded toYWRtaW5Ab3Blbm9ic2VydmUuZGV2OmFkbWl.Review the configuration you have provided and click Finish Configuration to save your cluster profile. This profile configures and deploys the Open Observe dashboard.
-
Navigate to the left main menu and select Clusters to view the cluster profile page. Select one of the healthy clusters that you have deployed as a prerequisite to this guide. The Overview tab appears.
Select the Profile tab. Then, select the + to add an add-on profile to this cluster. The list of cluster profiles appears.
Finally, select the
exporter-profileyou created in the previous step and click Confirm. Review the configuration and click Save. -
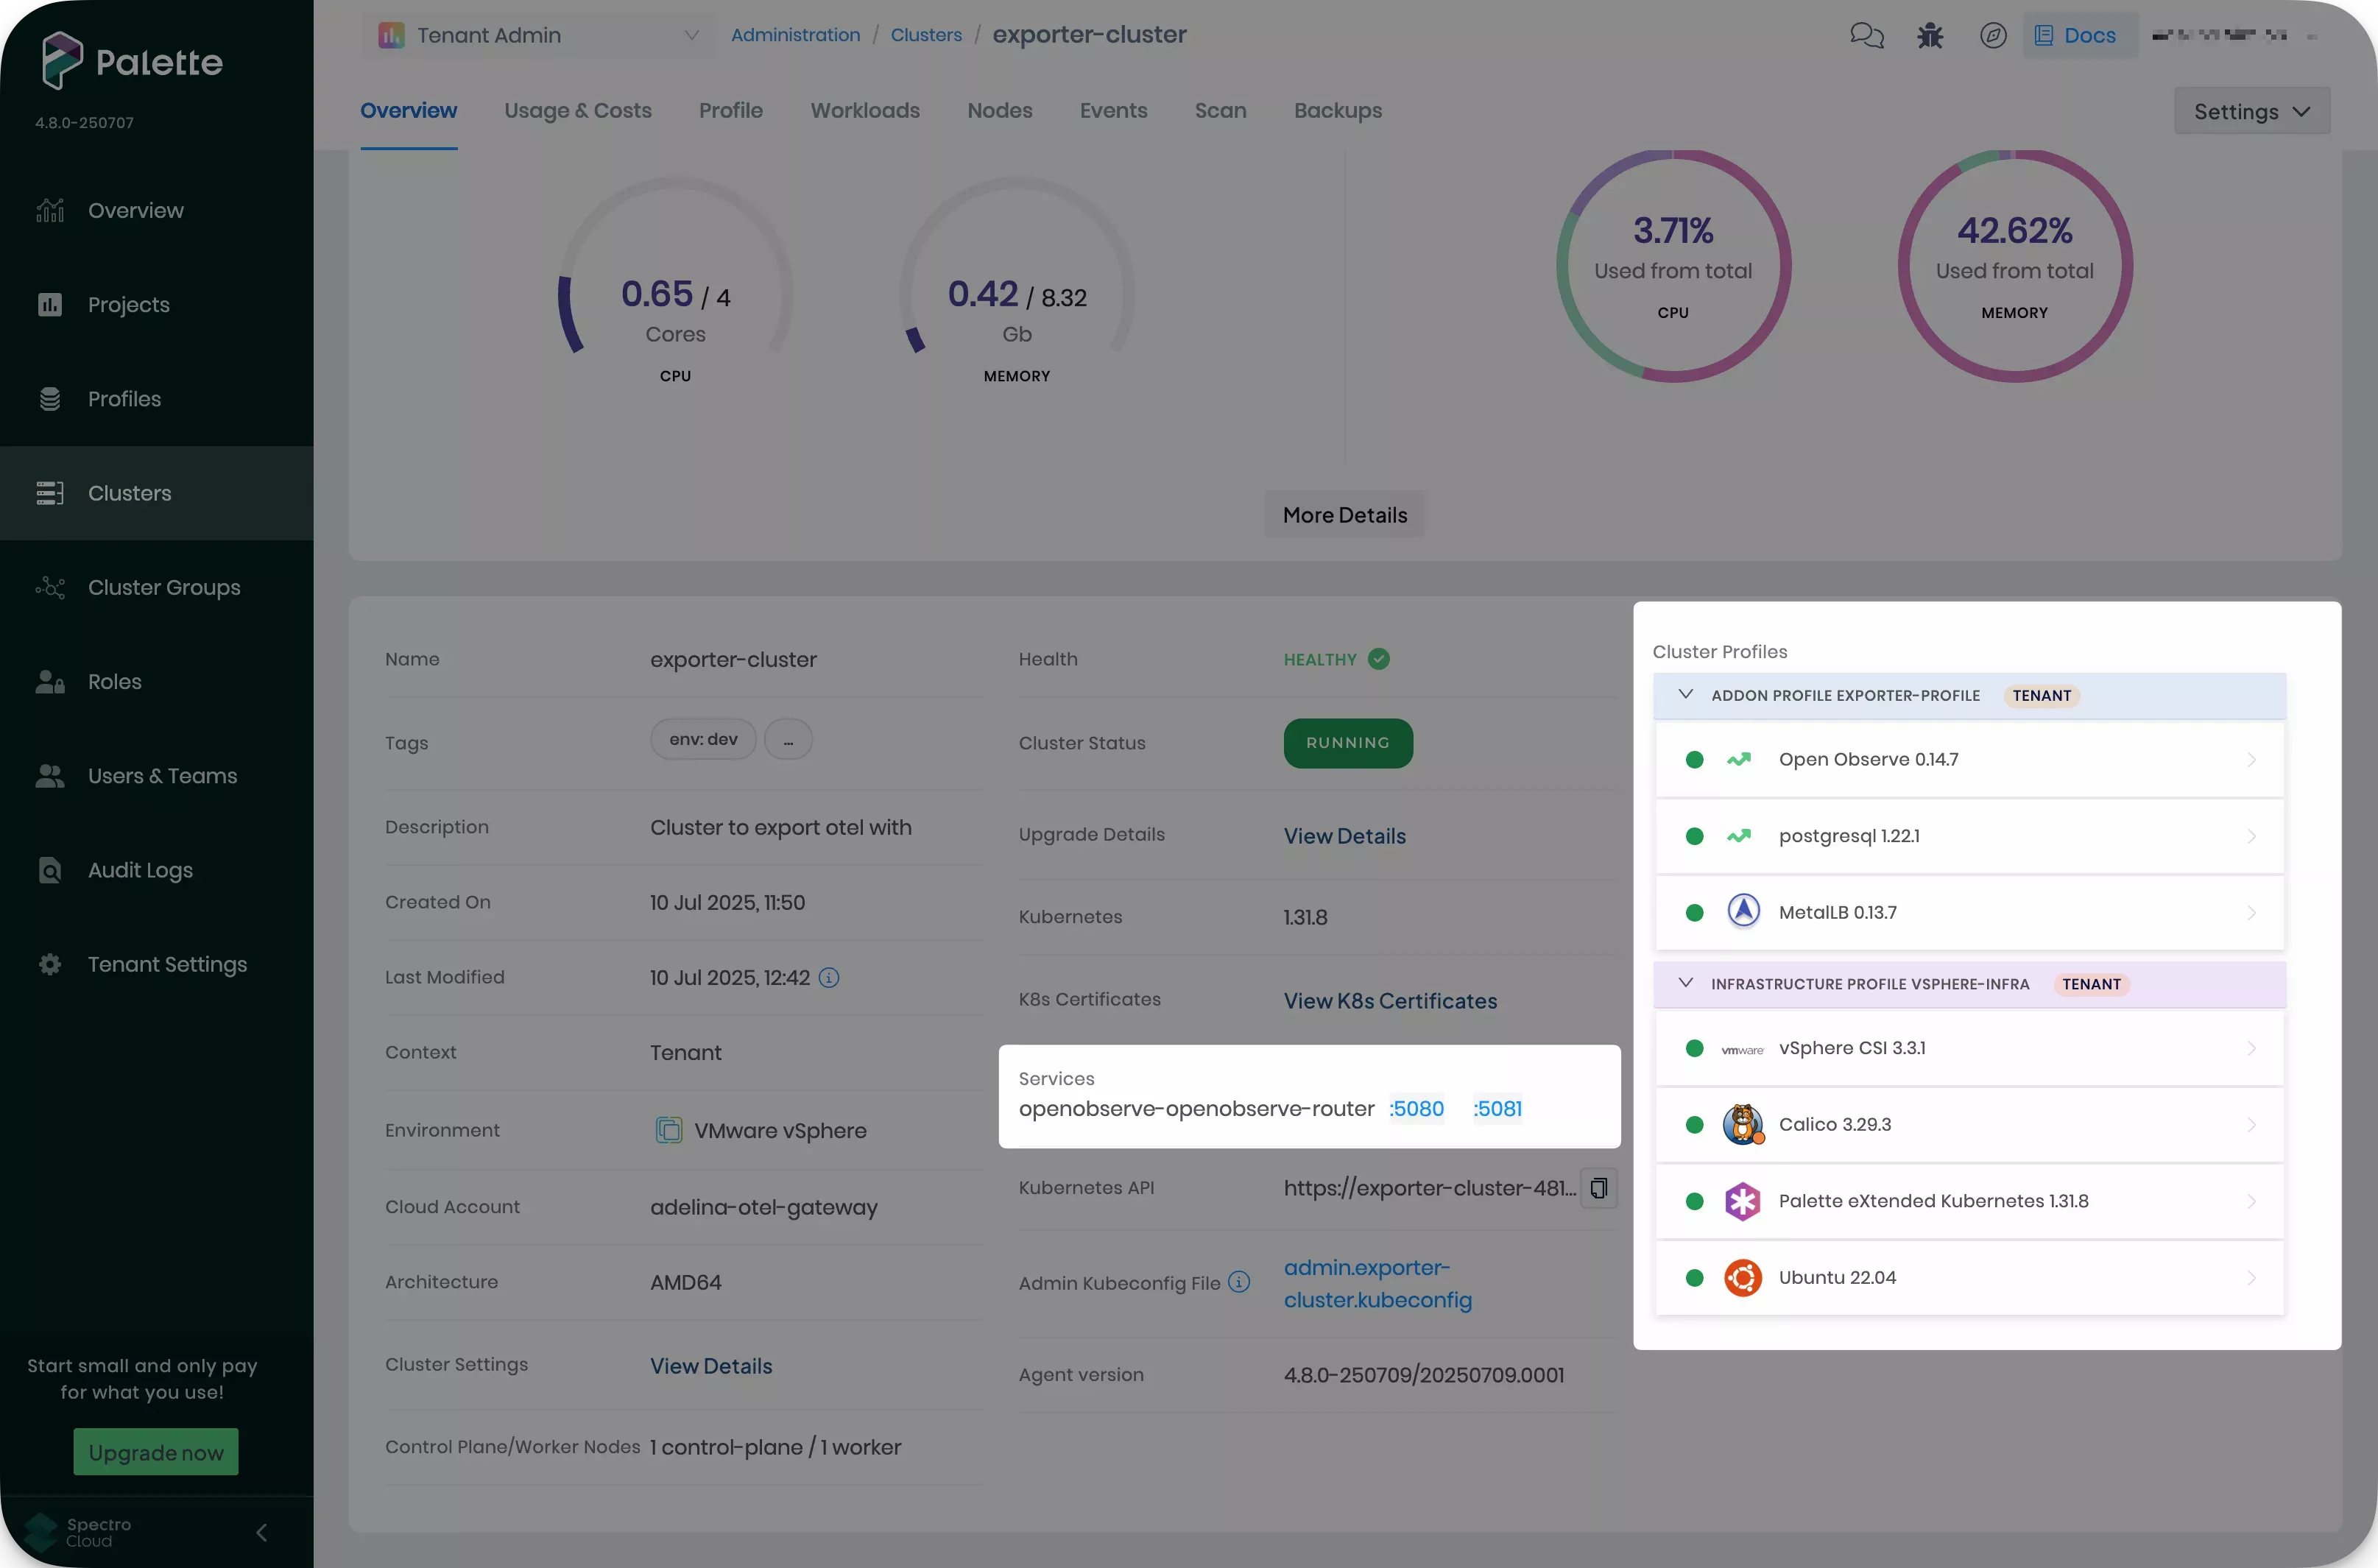
Select the Overview tab and monitor the progress of your add-on profile. This may take a few minutes. You will find two services deployed once the add-on profile is correctly applied.
Make a note of the address of the services by copying the link under port 5080.
Create and Deploy the Central Collector Cluster Profile
-
Log in to Palette.
-
Navigate to the left main menu and select Profiles to view the cluster profile page. Select Add Cluster Profile. The cluster profile creation wizard appears.
Enter
central-collector-profileas the name of the cluster profile. Then, select Add-on as the cluster profile Type and select Next.Add the following packs in your cluster profile with customizations that suit your environment. Then, select Next.
Pack Version Registry Customization MetalLB 0.13.x Palette Registry (OCI) Set an IP range that is available in your environment in the manifests.metallb.addressesfield.Open Telemetry 0.127.x Palette Registry (OCI) Click Presets. Select Enable under the central-collector section and select OpenObserve under the export section. Replace the domain placeholder in the charts.opentelemetry-collector.config.exporters.otlphttp/openobserve.endpointfield with the service address of the exporter service you deployed in the Create and Deploy the Exporter Cluster Profile section. Replace the password placeholder in thecharts.opentelemetry-collector.config.exporters.otlphttp/openobserve.headers.Authorizationfield with the Base64-encoded value you made a note of in Step 3 of the Create and Deploy the Exporter Cluster Profile section, keeping the prefixBasic. For example,Basic YWRtaW5Ab3Blbm9ic2VydmUuZGV2OmFkbWluses the encoded sample valueadmin@openobserve.dev:admin.Review the configuration you have provided and click Finish Configuration to save your cluster profile. This profile configures and deploys the Open Telemetry central collector.
-
Navigate to the left main menu and select Clusters to view the cluster profile page. Select one of the healthy clusters that you have deployed as a prerequisite to this guide. The Overview tab appears.
Select the Profile tab. Then, select the + to add an add-on profile to this cluster. The list of cluster profiles appears.
Finally, select the
central-collector-profileyou created in the previous step and click Confirm. Review the configuration and click Save. -
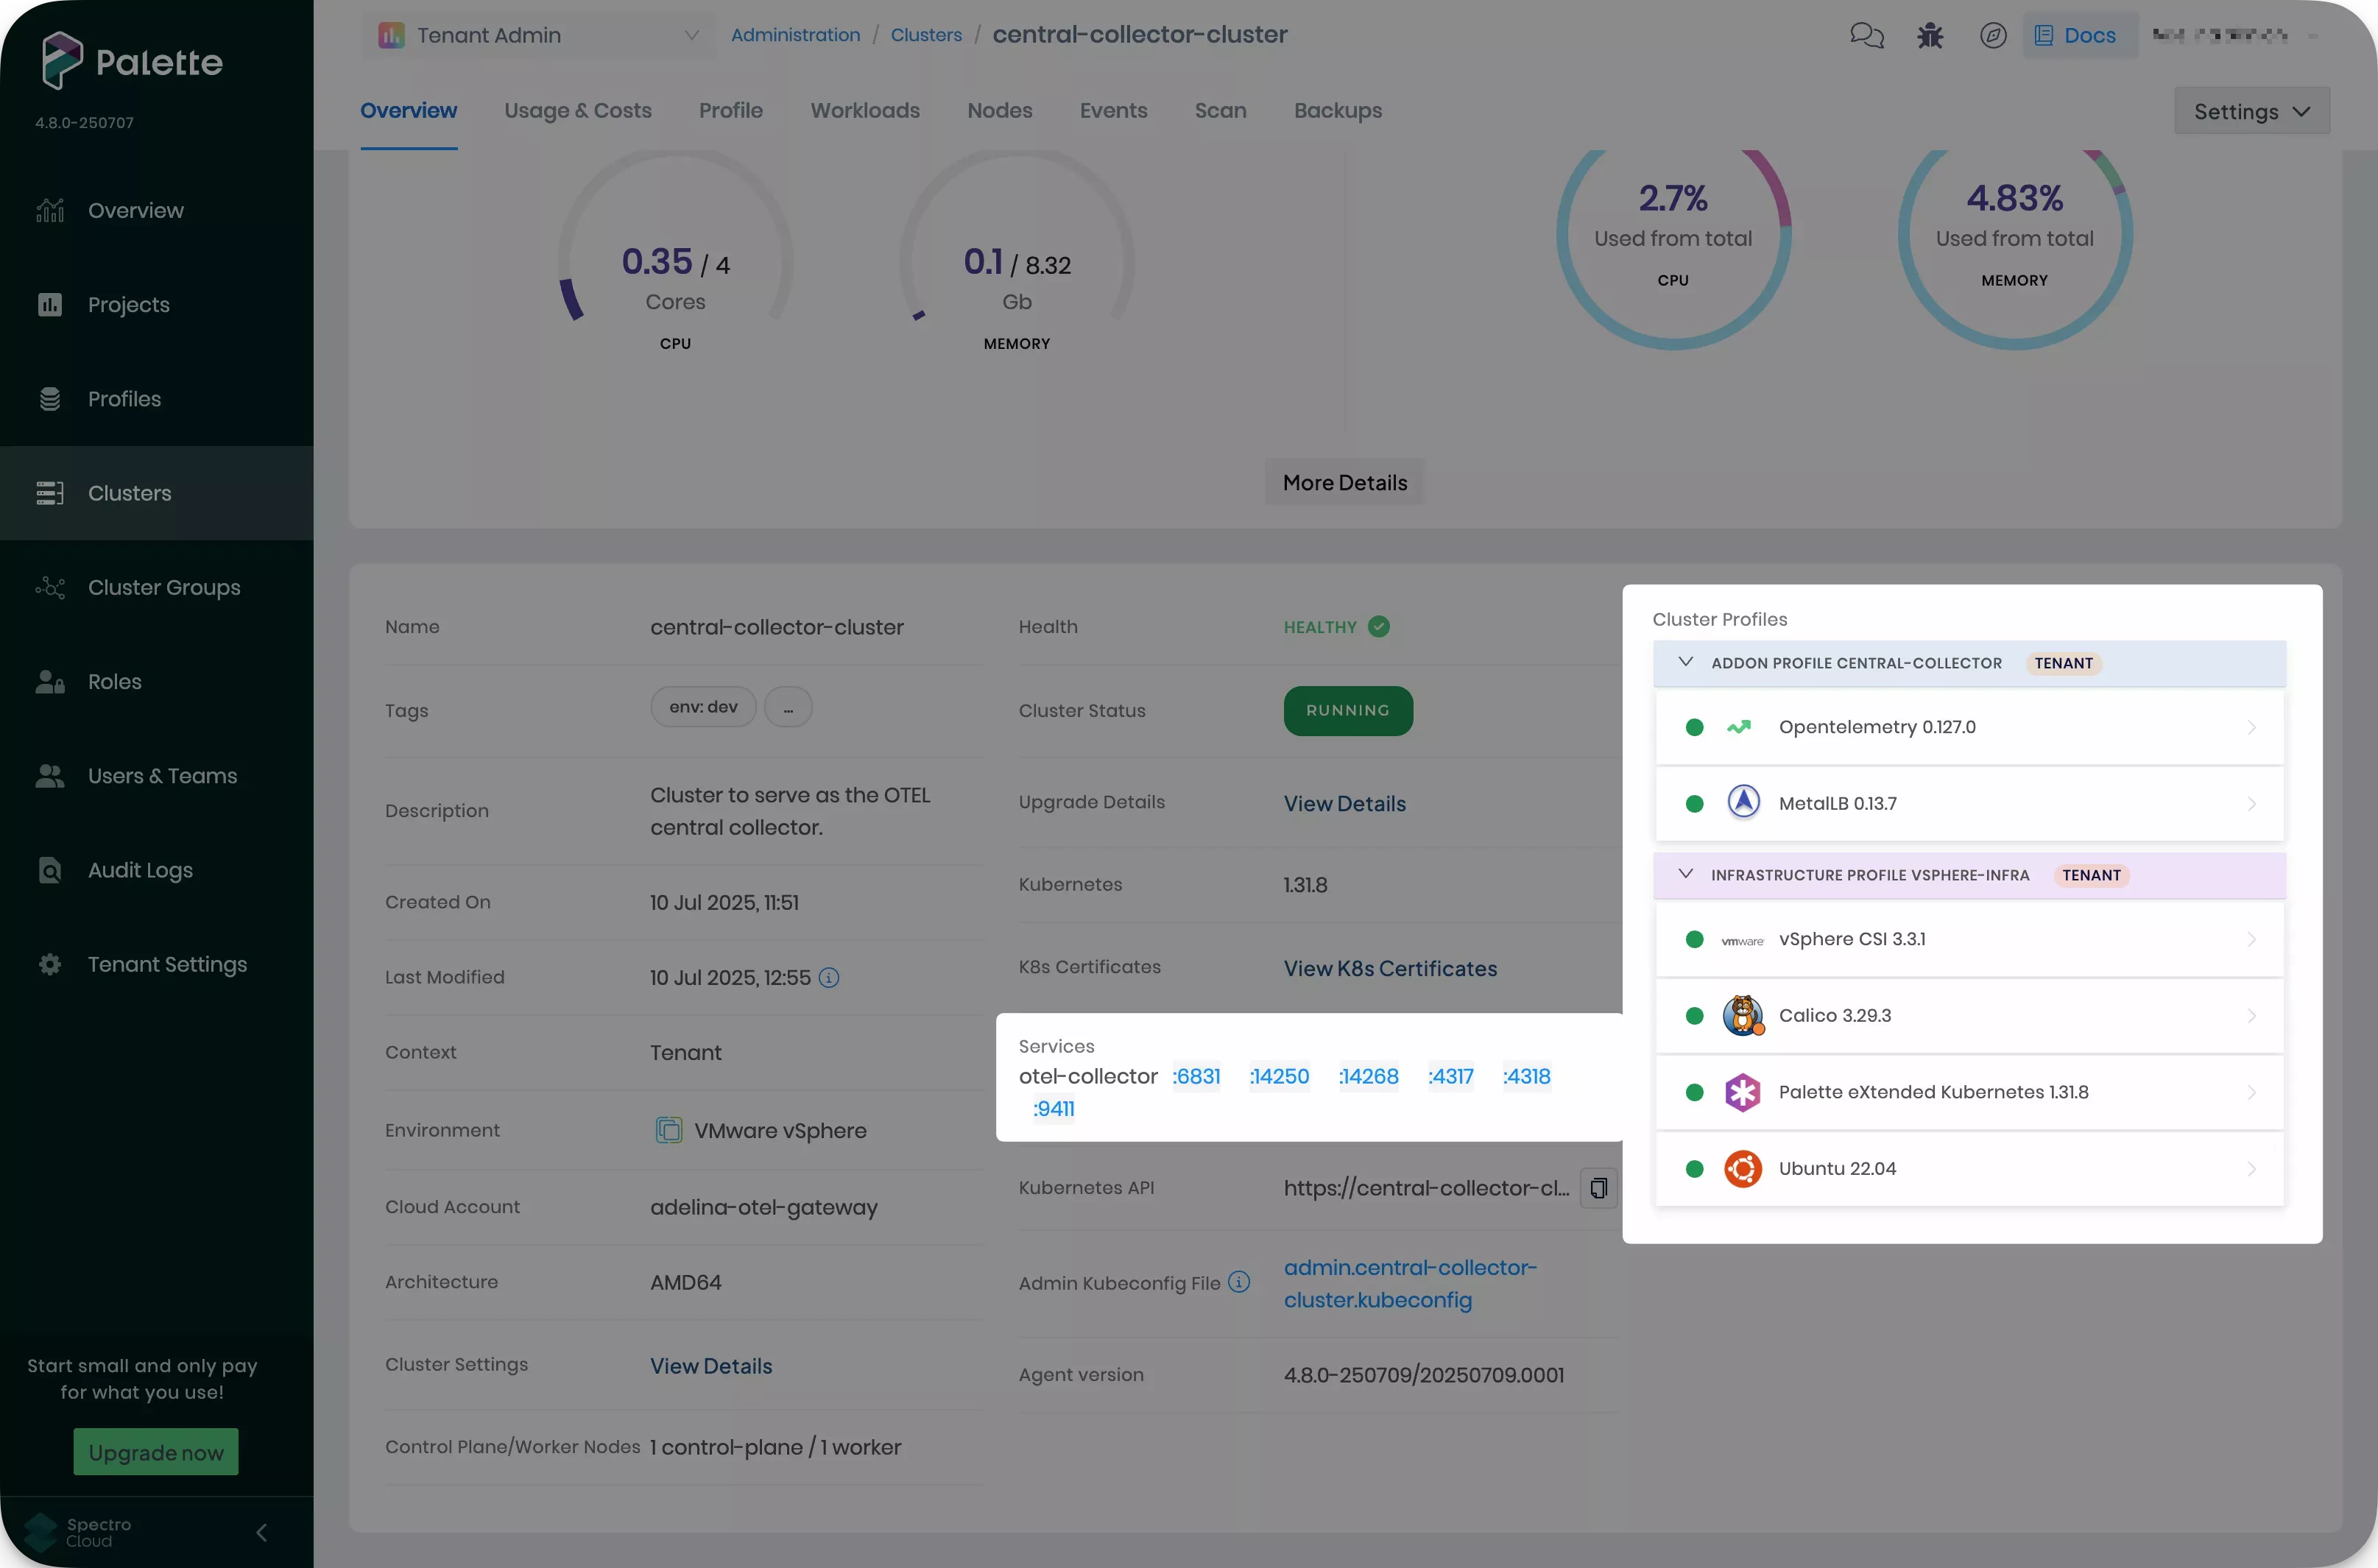
Select the Overview tab and monitor the progress of your add-on profile. This may take a few minutes. You will find six services deployed once the add-on profile is correctly applied.
Make a note of the address of the services by copying the link under port 4317.
Create and Deploy the Workload Cluster Profile
-
Log in to Palette.
-
Navigate to the left main menu and select Profiles to view the cluster profile page. Select Add Cluster Profile. The cluster profile creation wizard appears.
Enter
workload-profileas the name of the cluster profile. Then, select Add-on as the cluster profile Type and select Next.Add the following packs in your cluster profile with customizations that suit your environment. Then, select Next.
Pack Version Registry Customization Spectro Cluster Metrics 3.3.x Palette Registry (OCI) No customization required. Open Telemetry 0.127.x Palette Registry (OCI) Click Presets. Select Central Otel under the export section. Replace the domain placeholder in the charts.opentelemetry-collector.config.exporters.otlp.endpointfield with the service address of the exporter service you deployed in the Create and Deploy the Central Collector Cluster Profile, without thehttps://orhttp://protocol.Review the configuration you have provided and click Finish Configuration to save your cluster profile. This profile configures and deploys the Open Telemetry workload collector. It also deploys the Spectro Cluster Metrics pack to gather additional metrics from the cluster.
tipYou can add any other monitoring, logging, or tracing pack that is compatible with the OpenTelemetry Protocol to the workload collector cluster profile. We recommend configuring the Prometheus - Grafana pack for monitoring production workloads.
-
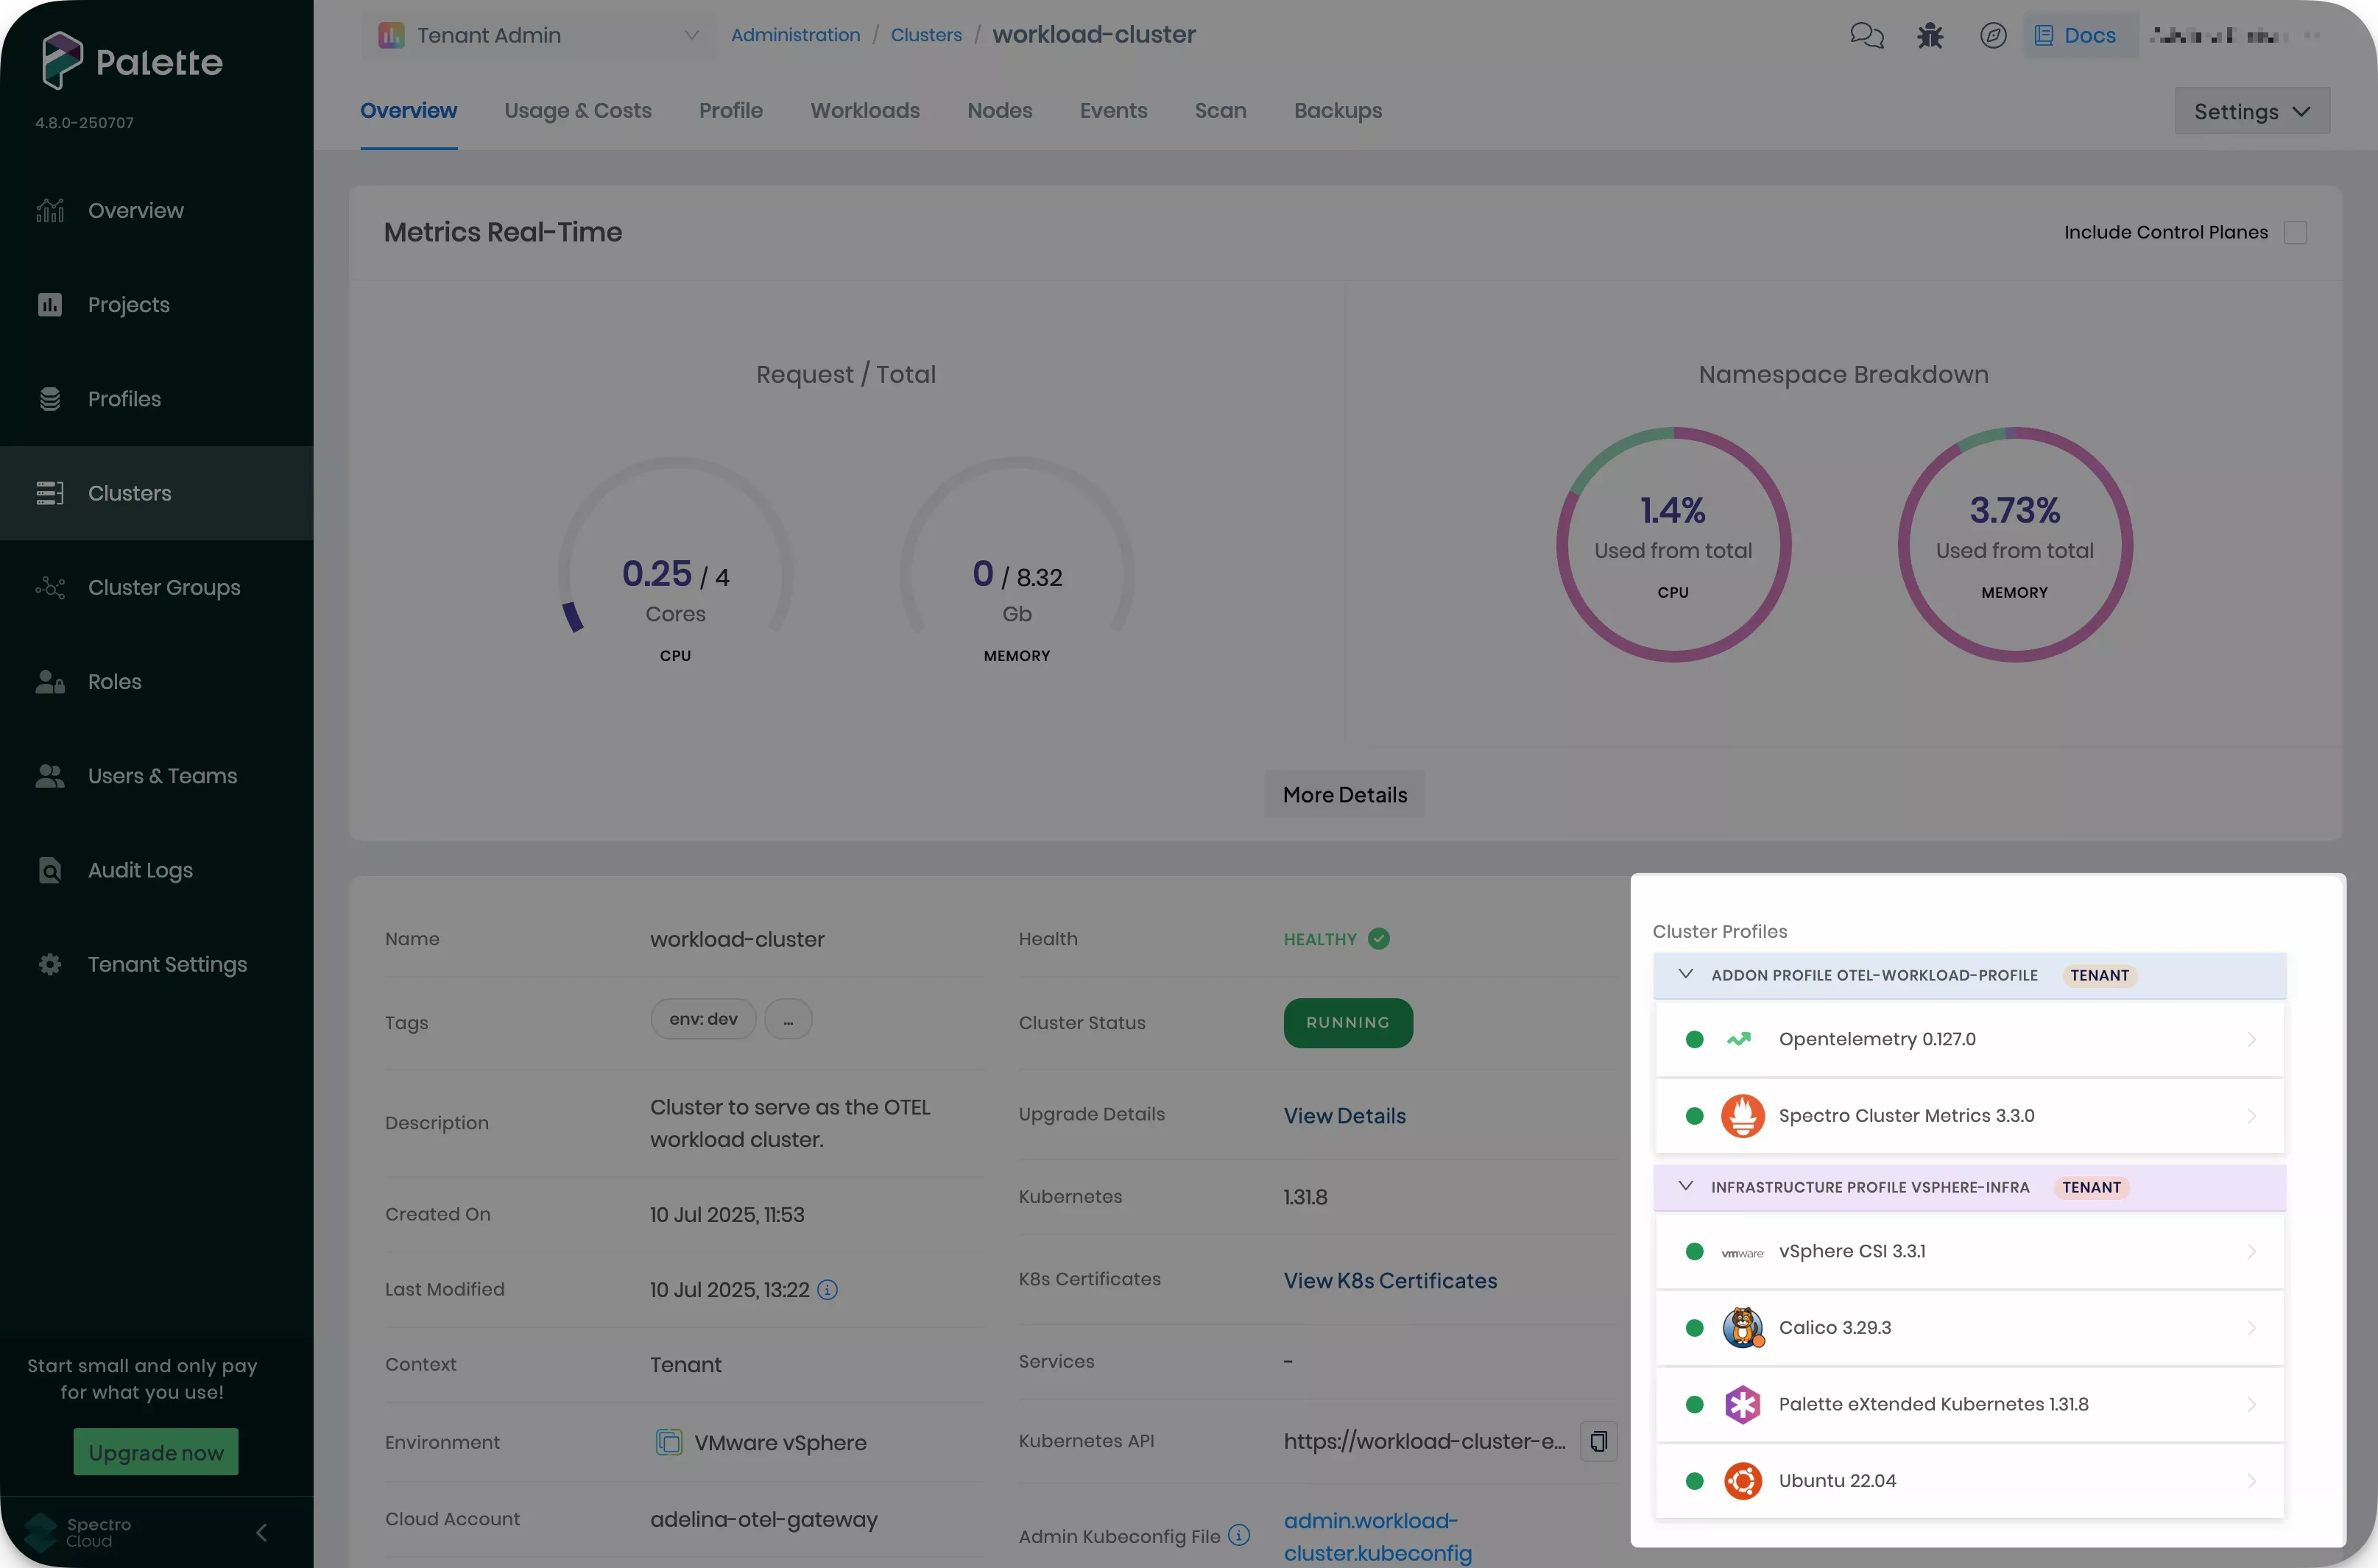
Navigate to the left main menu and select Clusters to view the cluster profile page. Select one of the healthy clusters that you have deployed as a prerequisite to this guide. The Overview tab appears.
Select the Profile tab. Then, select the + to add an add-on profile to this cluster. The list of cluster profiles appears.
Finally, select the
workload-profileyou created in the previous step and click Confirm. Review the configuration and click Save.tipYou can deploy this profile to as many workload clusters as you want to monitor. They will all connect and send data to the central collector cluster.
-
Select the Overview tab and monitor the progress of your add-on profile. This may take a few minutes. Palette marks all cluster profile layers with a green indicator once they are successfully deployed.
Validation
-
Log in to Palette.
-
Navigate to the left main menu and select Clusters to view the cluster profile page. Select the cluster that you have deployed the
exporter-profileto in the Create and Deploy the Exporter Cluster Profile section. The Overview tab appears. -
Open the Open Observe dashboard by clicking on the link under 5080. The Open Observe login page appears. Enter the user email and password that you configured in the cluster profile. Then, click Login.
-
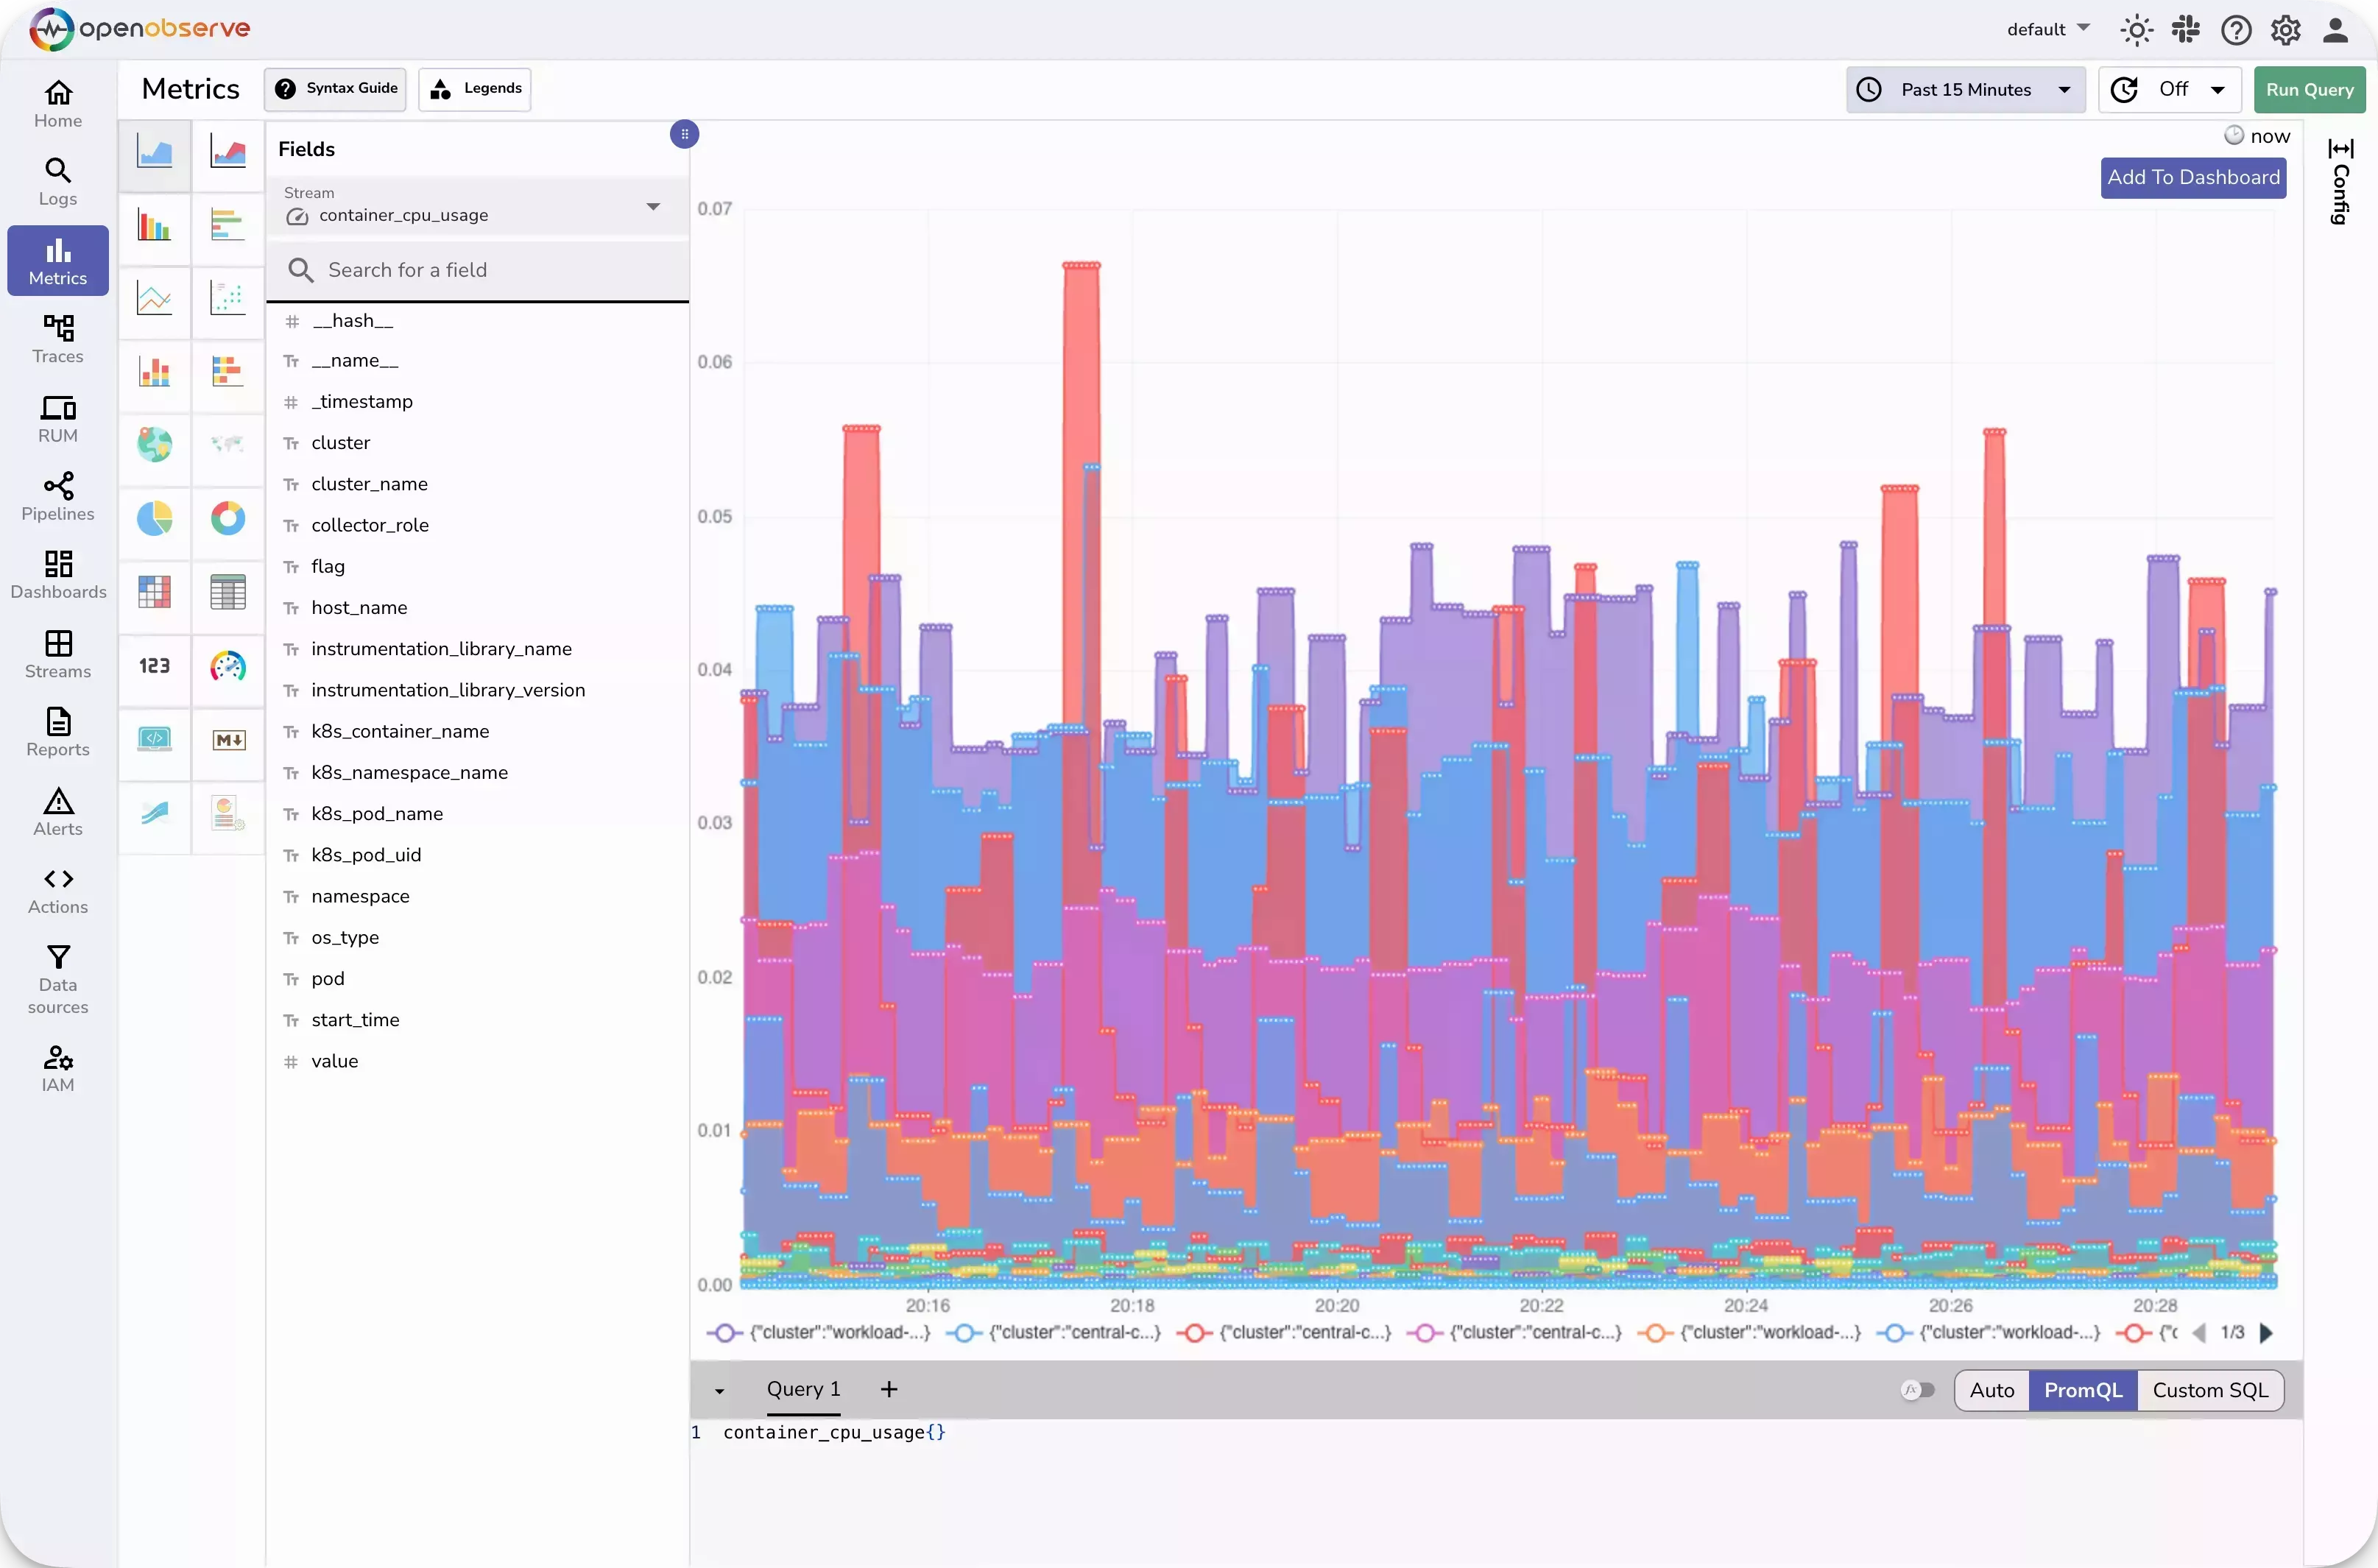
The Open Observe dashboard appears. The exporter contains metrics from all workload clusters and the central collector.
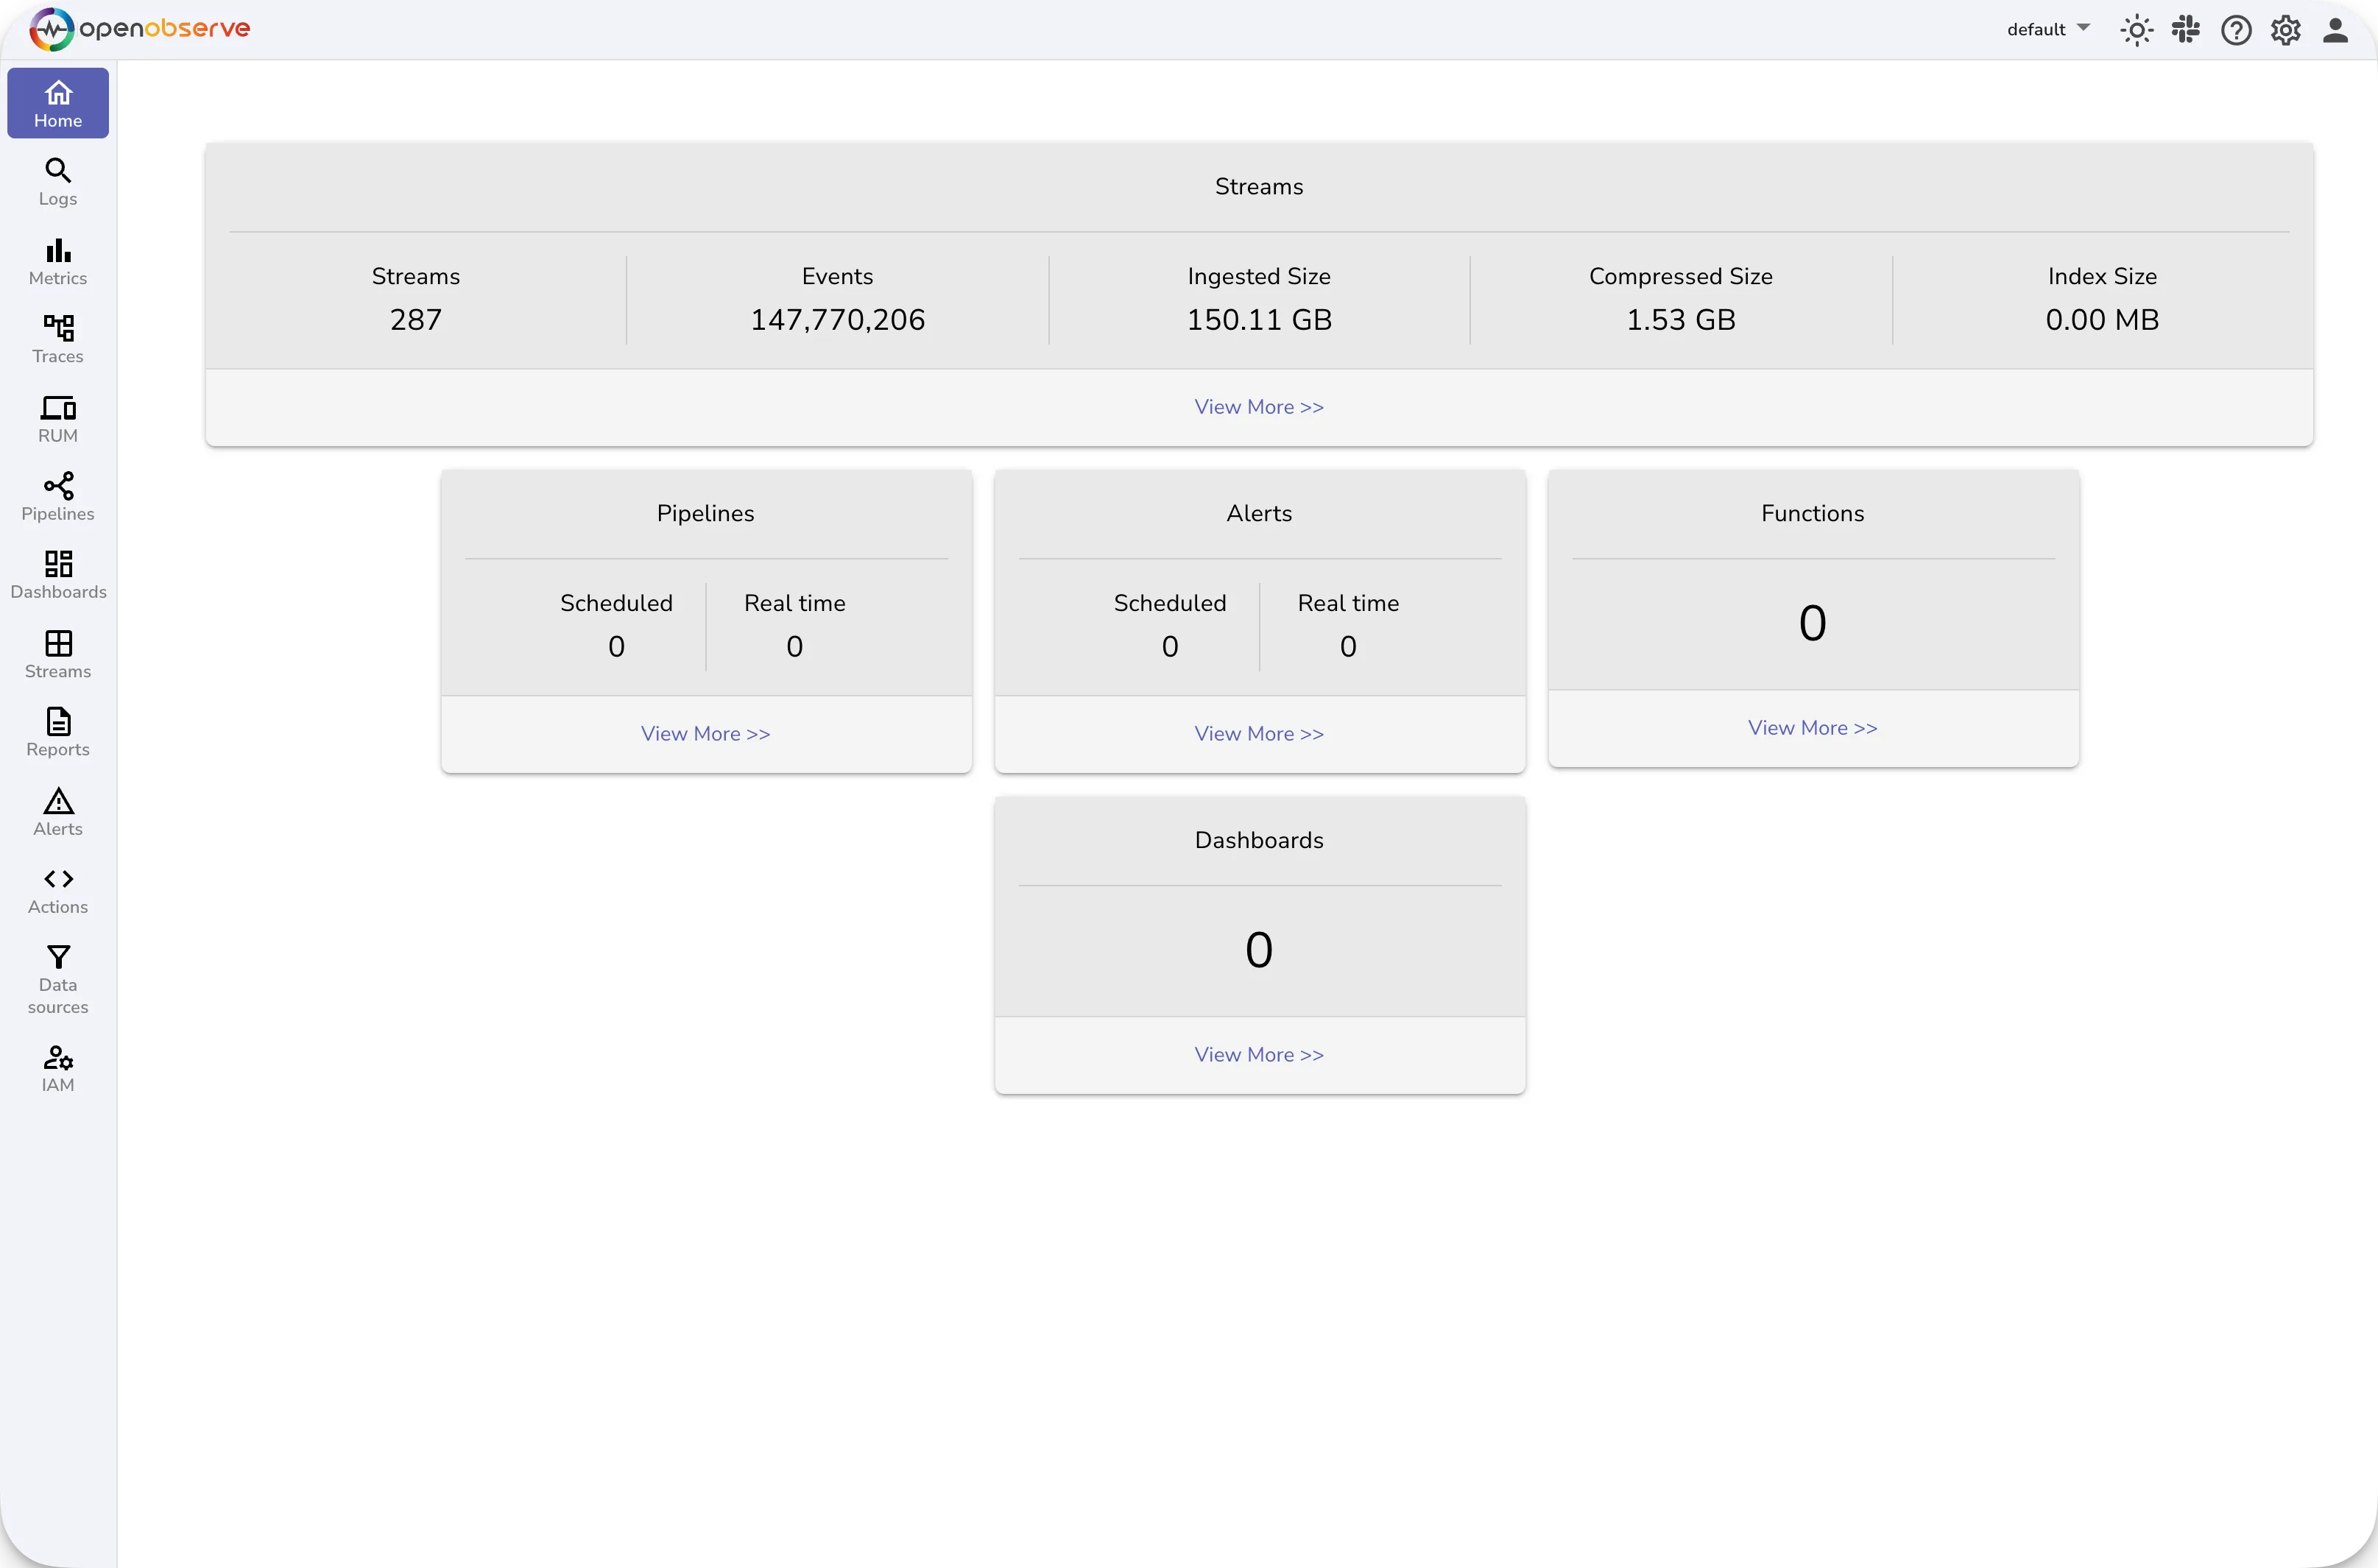
The Metrics tab allows you to create various types of charts to visualize your workload cluster metrics.
The Open Observe dashboard contains a wealth of functionality that you can use to monitor and track the health of your clusters. Refer to the Open Observe documentation for further information.